

Return on ad spend, or ROAS, measures the revenue you earn for every dollar spent on advertising. The formula is simple: revenue attributable to ads divided by ad spend. Spend $2,000 and generate $8,000 in attributed revenue, and your ROAS is 4:1, or 400%. That number tells you how efficiently a campaign converts spend into revenue, but it doesn’t tell you whether the campaign is profitable, which is where most business owners get tripped up. Organisations like the Corporate Finance Institute and Google Ads publish detailed guidance on this exact distinction, and West Legacy Group applies the same logic when auditing small business ad accounts.
ROAS in one line: Revenue from ads ÷ ad spend = ROAS. A 4:1 ratio means $4 back for every $1 spent.
Key Takeaways
A high ROAS figure is meaningless without knowing what counts as attributed revenue, what’s included in ad spend, and what your margin requires to stay profitable.
| Point | Details |
|---|---|
| Formula stays constant | ROAS equals revenue attributable to ads divided by ad spend, shown as a ratio or percentage. |
| Margin sets your real target | A 20% margin needs roughly 5:1 ROAS to break even; a 50% margin needs around 2:1. |
| ROAS and ROI answer different questions | ROAS measures revenue efficiency; ROI accounts for profit after all costs. |
| Attribution windows distort results | Wide windows and existing-customer clicks can inflate attributed revenue beyond real incremental impact. |
| West Legacy Group fixes the tracking first | Our digital marketing and reporting services set up accurate ROAS measurement before recommending any spend changes. |
Table of Contents
- What does return on ad spend mean in practice?
- How do you calculate ROAS step by step?
- How is ROAS different from ROI?
- What counts as a good ROAS?
- Why can ROAS numbers be misleading?
- How can you improve your ROAS?
- Frequently Asked Questions
- Sources
What does return on ad spend mean in practice?
ROAS is a ratio, and you can express it two ways: as a multiple or as a percentage. Both describe the same relationship; agencies and platforms like Google Ads and Meta tend to favour the ratio format, while finance teams often prefer percentages because they slot neatly into spreadsheets alongside other margin figures.
The formula itself has two moving parts, and each one hides a decision:
- Revenue attributable to ads – this is whatever your attribution model credits to a given campaign, not necessarily every dollar a customer ever spends with you.
- Ad spend – this can mean media cost alone (what you paid the platform) or a fully loaded figure that includes creative production, agency fees, and platform charges.
Here’s the catch: two businesses can both report “4:1 ROAS” while one counted media spend only and the other included production costs. Neither number is wrong, but they aren’t comparable. Before you benchmark against anyone else’s ROAS, or your own from last quarter, confirm what actually sits inside each side of the equation.
How do you calculate ROAS step by step?
Calculating ROAS correctly is less about the maths and more about the decisions you make before you plug in the numbers. Follow this sequence:
- Pick your conversion action and attribution window. Decide whether you’re measuring purchases, leads, or bookings, and set a window (seven days, 30 days) that matches your typical sales cycle.
- Decide how revenue gets attributed. Last-touch attribution credits the final click before conversion; multi-touch spreads credit across the customer’s path; incremental measurement asks what revenue wouldn’t have happened without the ad at all.
- Total your ad spend for that same window. Add up media cost, and decide upfront whether creative production and agency fees belong in the calculation.
Worked example: a Bendigo homewares retailer runs a 14-day Google Shopping campaign, spends $3,500 on media, and its analytics platform attributes $15,750 in sales using last-touch attribution within a 7-day click window. The ROAS in this example indicates a multiple of revenue generated relative to ad spend. Google Ads’ own guidance on measuring campaign returns walks through similar conversion tracking setups, and getting that tracking right before you calculate anything is half the job.
How is ROAS different from ROI?
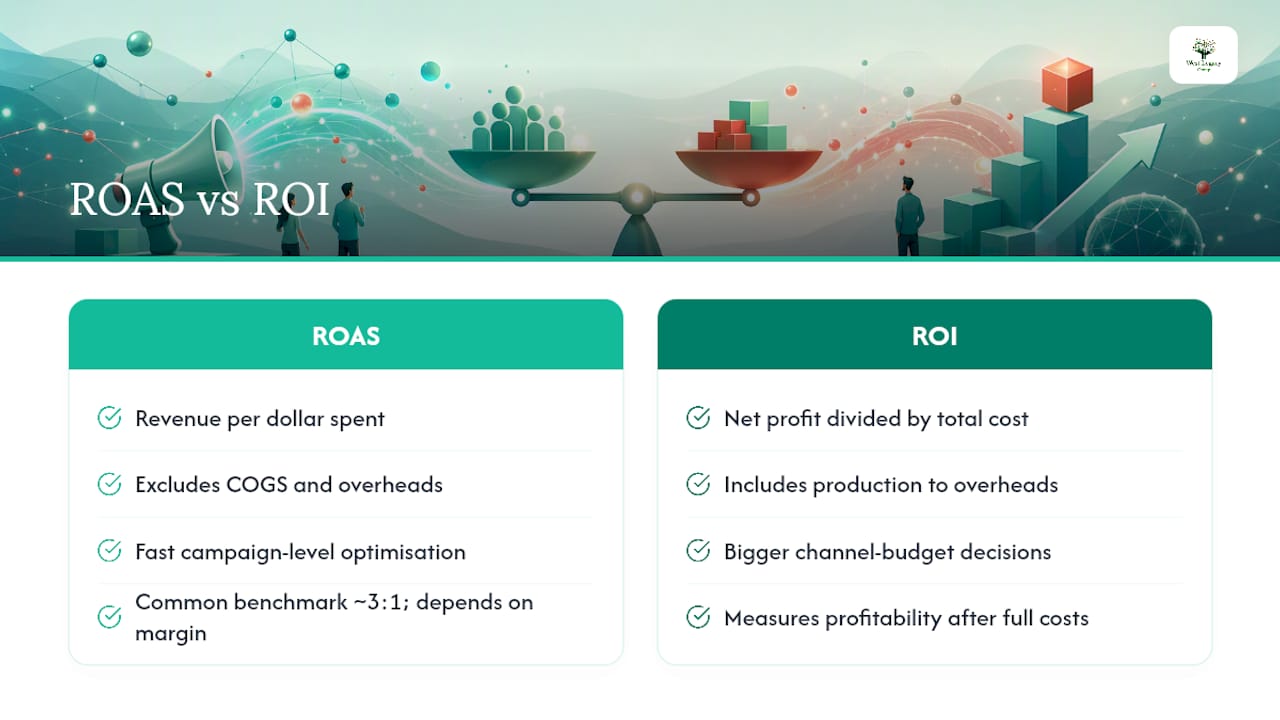
ROAS and ROI both measure advertising performance, but they answer different questions. ROAS asks “how much revenue did this ad generate?” ROI asks “how much profit did I actually keep after every cost?” ROI’s formula is (net profit ÷ total cost) × 100, and it accounts for cost of goods sold, overheads, and the full expense of running the campaign, not just the media buy.
A related metric, ACOS (advertising cost of sale), is essentially ROAS inverted: ad spend divided by revenue, expressed as a percentage. It’s common on Amazon and shopping platforms, and a lower ACOS means the same thing as a higher ROAS.
- Use ROAS for daily and weekly campaign optimisation, since it’s fast to calculate and easy to compare across ad sets.
- Use ROI when deciding whether a channel or campaign deserves ongoing budget, because it factors in margin.
- ROAS works best for granular, tactical decisions, while ROI answers the bigger strategic question of whether the whole exercise made money.
What counts as a good ROAS?
There’s no universal “good” ROAS, and any benchmark you read online needs a margin caveat attached. HubSpot commonly cites 3:1 as a reasonable target, with breakeven sitting around 1:1 depending on your cost structure.
Here’s the arithmetic that actually matters:
- If your gross margin is 20%, you need roughly 5:1 ROAS just to break even on the ad spend itself, before covering any other overheads.
- If your gross margin is 50%, breakeven arrives around 2:1, leaving far more room for the campaign to be genuinely profitable at a 3:1 or 4:1 return.
- Retail and eCommerce with thin margins typically need higher ROAS targets than SaaS or services businesses with high margins and recurring revenue.
Pro Tip: Divide 1 by your gross margin percentage to find your breakeven ROAS. Anything above that is genuine profit contribution.
Why can ROAS numbers be misleading?
A high ROAS can sit right alongside a business that’s losing money, and this is the single most common misunderstanding small business owners have about the metric; understanding pricing and margin leakage is essential, as explained in Why Is My Service Business Busy but Not Profitable? The Corporate Finance Institute is blunt about it: ROAS measures revenue efficiency, not profit, and it never deducts cost of goods sold or operating expenses.
Watch for these specific traps:
- Attribution windows set too wide. A 30-day window can credit ads with sales that would have happened anyway.
- Existing customer revenue counted as ad-driven. If a loyal customer clicks a retargeting ad before buying something they’d already decided on, that’s not incremental revenue.
- Fully loaded costs excluded. Media spend alone understates true acquisition cost once you add creative, agency fees, and platform charges.
- Attributed revenue treated as incremental revenue. IAB Australia’s measurement guidance specifically warns against assuming the two are the same, since attribution tools credit ads for conversions that may have happened regardless.
Pro Tip: Run a simple holdout test: pause ads for a small, comparable audience segment for two weeks and compare their conversion rate to the group still seeing ads. The gap is closer to your true incremental lift than raw attributed revenue.
How can you improve your ROAS?
Improving ROAS comes down to moving one of two levers: increase the revenue side, or reduce the spend side, without sacrificing volume. Work through these in priority order:
- Fix landing page conversion first. A campaign sending traffic to a slow or confusing page wastes spend regardless of how good the targeting is. This is usually the highest-leverage fix, and it’s where conversion rate optimisation work pays off fastest.
- Tighten targeting before increasing budget. Broad targeting dilutes spend across low-intent audiences; narrower, higher-intent segments usually lift ROAS even at lower volume.
- Raise average order value. Bundle offers, minimum spend thresholds for free shipping, and upsells all increase revenue per conversion without touching spend.
- Test creative and offers systematically. Search campaigns respond to offer clarity; social campaigns respond to creative variety; Shopping campaigns respond to product feed quality and pricing competitiveness.
- Run incrementality tests alongside optimisation. Combine attributed ROAS with cohort payback analysis, particularly if you rely on repeat purchases, so you know whether customer lifetime value actually covers acquisition cost.
Pro Tip: When you find incremental budget, push it toward the channel showing the steepest ROAS decline as spend increases; that’s usually your most efficient channel, and it has the most room left to scale before diminishing returns kick in.
A practical note from West Legacy Group
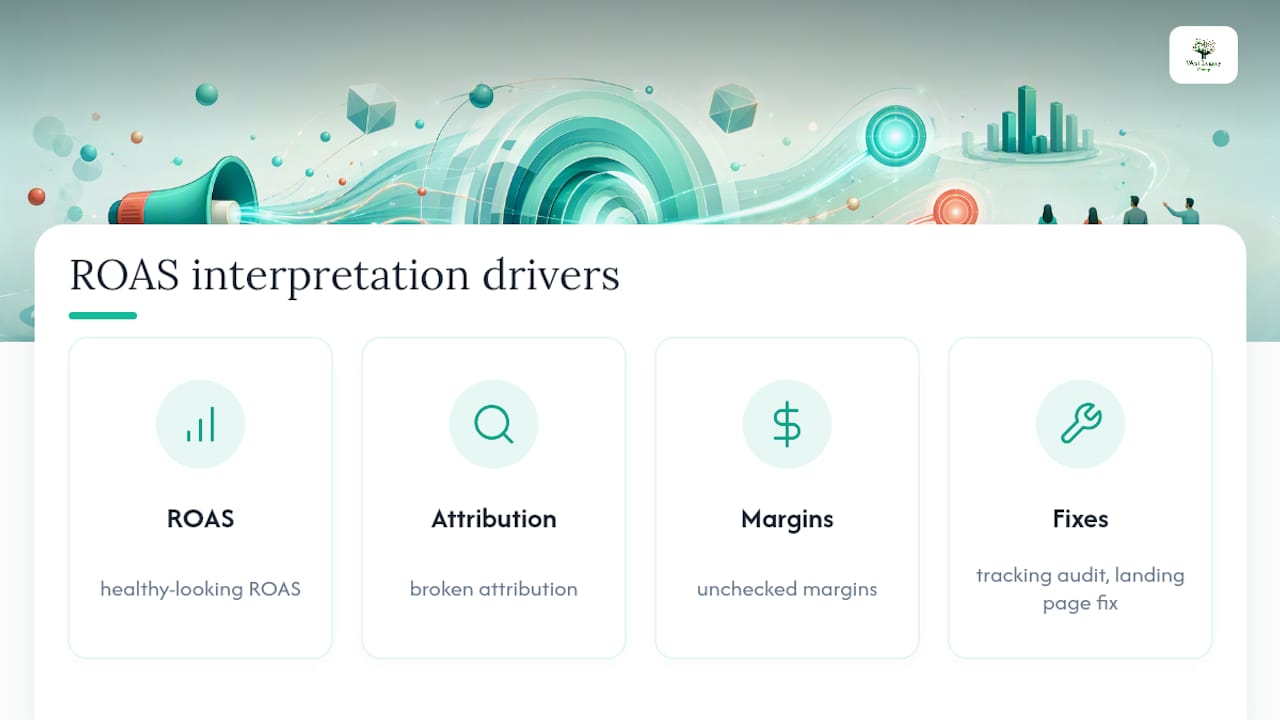
Working through small business ad accounts, the same pattern shows up again and again: healthy-looking ROAS sitting on top of broken attribution or unchecked margins. The fix is rarely more spend. It’s usually a tracking audit, a landing page fix, or both.
Want a clearer read on your ad performance?
If you’ve read this far, you already know that a strong ROAS figure means little without accurate attribution sitting underneath it. That’s the gap West Legacy Group closes for small business owners: rather than handing you a dashboard full of numbers and leaving you to interpret them, we set up the tracking properly first, then help you act on what it actually shows.
Whether that means fixing a landing page that’s leaking conversions, tightening up your Google Analytics attribution, or building reporting you can actually trust, our digital marketing support is built for small business budgets, not enterprise retainers. If tracking and reporting are your bigger headache right now, our reporting services page covers how we set up dashboards that separate attributed revenue from genuine incremental lift. Get in touch through Westlegacygroup and we’ll start with an honest look at what your current numbers are actually telling you.
Frequently Asked Questions
What does return on ad spend mean compared to profit?
ROAS measures revenue generated per dollar spent on ads. It doesn’t subtract cost of goods sold or overheads, so a campaign can show strong ROAS and still lose money once real costs are factored in.
Is a 3:1 ROAS good?
It depends entirely on your gross margin. A commonly cited benchmark sits around 3:1, but a low-margin retailer might need 5:1 or higher to be profitable, while a high-margin service business could turn a profit well below 3:1.
What’s the difference between ROAS and ROI in advertising?
ROAS divides revenue by ad spend; ROI divides net profit by total cost, including everything from production to overheads. ROAS suits fast campaign-level optimisation, and ROI suits bigger decisions about which channels deserve ongoing budget.
Why does my ROAS look good but my business isn’t more profitable?
This usually points to thin margins, fully loaded costs excluded from the spend figure, or attribution crediting ads for sales that would have happened anyway. Running an incrementality check against a holdout audience often reveals the gap.